The Experimental Design
Building a controlled laboratory to isolate and measure codebase traversal costs.

Lead Software Engineer & Systems Architect
- The Context Economics Event Model (CEEM) for normalizing raw agent operations.
- Establishing an isolated reference corpus across monolithic, modular, and fragmented topologies.
- Designing 5 controlled operational case studies to measure pure traversal overhead.
The Economics of Machine Comprehension Part 3: Designing a benchmark to measure how AI explores software.
Previously, I suggested that the physical architecture of a repository vastly affects the computational cost of machine comprehension. If this holds true, that means that deep architectural entanglement forces an AI agent to consume large computational resources simply to navigate fragmented directory boundaries and acquire the necessary execution context. The question is, how can we make it visible? Can we measure it? Transitioning this concept from a theoretical hypothesis into a measurable engineering reality is the mechanical challenge we will tackle now.
Current observability relies entirely on final outcomes. Engineering departments review monthly cloud invoices, track aggregate token consumption, and measure the overall execution duration of assigned tasks. These metrics are what we call lagging or trailing indicators. They record exactly what the final computational cost was, but they remain silent on the specific mechanical reasons that cost occurred. They quantify the financial impact without revealing the underlying architectural friction. This dynamic creates an engineering hurdle because the financial invoices are merely the lagging shadow of machine execution. A methodology is required to observe the execution itself. Before an experiment can be designed to test the architectural hypothesis, the industry requires a mechanism to systematically observe the machine.
The Visibility Gap
When a human engineer joins a development team, the process of understanding the codebase is highly observable. Senior engineers can track which files the new developer opens, review the architectural questions asked during pairing sessions, and analyze the dependency diagrams drawn on whiteboards. If a human engineer is confused by a convoluted service boundary, that issue is immediately visible to the organization. Software teams possess a built-in, intuitive observability for human context acquisition.
On the other hand, when an autonomous AI agent navigates that exact same codebase, this visibility vanishes. The industry manages AI integration almost exclusively through outcome metrics, so it is currently impossible to determine where the agent spent its time during execution. The telemetry does not show what specific interface the model was searching for when it initiated a recursive directory scan, nor does it reveal which files the agent repeatedly revisited because the architectural boundaries were poorly defined. Most importantly, the dashboard cannot differentiate between token expenditure that was strictly productive and token expenditure that was purely exploratory.
Because these questions remain unanswered, AI-assisted development is managed by reacting to its financial footprint. If an autonomous agent successfully completes a task but consumes an unreasonable volume of tokens in the process, the architectural inefficiency remains entirely invisible to the user. The code compiles, the feature ships, and the exorbitant token cost is silently absorbed into the corporate invoice. Vendor side optimizations are the only gateway to manage token costs, which solves only half the problem.
Figure 3.1
The Visibility Gap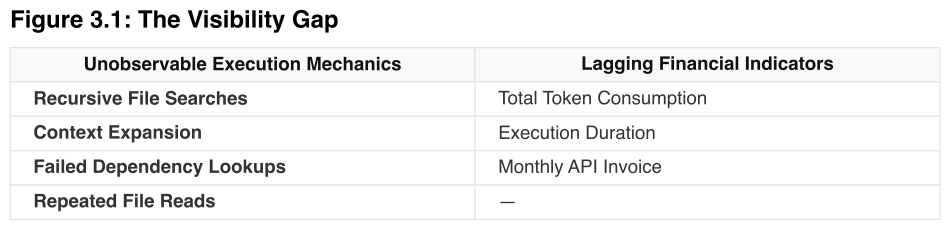
Tracking Execution Activity
While the internal processing logic of an AI agent remains pretty much opaque to financial dashboards, the actual execution of a task generates decently measurable system data. When an autonomous AI agent receives an instruction to implement a new feature, it does not instantly possess the understanding of the complete codebase. It acquires context by executing discrete shell commands against the repository.
This mechanism requires a change in approach for engineering observability as it is quite difficult to observe a statistical AI model’s internal reasoning from the developer-end, but it is entirely possible to log its exact command sequence. As an agent navigates a codebase, its interactions with the environment are distinct, mechanical, and visible to the underlying platform. When the agent looks for an entry point, it executes a directory search. When it attempts to understand an interface, it reads a specific file. When it implements business logic, it creates or modifies text files. When it verifies the implementation, it executes test suites and triggers build processes.
Searching, reading, creating, modifying, testing, and building are concrete interactions with the file system. An agent cannot acquire context without reading files, and it cannot verify logic without running tests. So every time the machine takes one of these actions, it generates a discrete log entry. By shifting the focus away from the model’s internal reasoning and concentrating entirely on the commands it executes, the visibility problem is resolved. The raw execution logs generated during a task are filled with these mechanical interactions, allowing us to reconstruct the agent’s exact timeline.
From Activity to Observation
Recognizing that autonomous agents generate execution logs is the first requirement, but raw terminal output is actually insufficient for our engineering analysis. Reviewing raw execution logs produces a chaotic stream of directory listings, file system events, and unstructured API calls. An engineer might manually notice that the agent read twenty files and failed three tests, but without a structured methodology to categorize those commands, the observation remains entirely anecdotal.
Additionally, engineering requires strict dimensional accuracy. To study how different repository architectures affect machine comprehension, the machine’s traversal must be described using standardized terminology. If one engineering team describes an agent as “getting lost in the folders” and another describes it as “hitting the context limit,” both teams are observing the identical architectural friction but completely lack the standardized vocabulary to measure it across the enterprise.
So, this visibility gap demands a standardized event model. When analyzing failed execution trajectories, the chaotic terminal output naturally groups into eight canonical categories. My initial classification attempts often treated all navigation as a single event type, combining directed file searches with exploratory directory reads. That conflation masked a critical distinction, which was: an agent searching for a specific known file executes entirely different logic than an agent scanning directories with no clear target. Separating these actions into distinct SEARCH and READ categories provides the taxonomy with necessary diagnostic precision. To observe and record machine comprehension, in this investigation I would like to introduce the Context Economics Event Model (CEEM).
CEEM operates strictly as a behavioral vocabulary. It encompasses the entirety of an autonomous agent’s interaction with a codebase through eight discrete events:
Figure 3.2
The Context Economics Event Model (CEEM)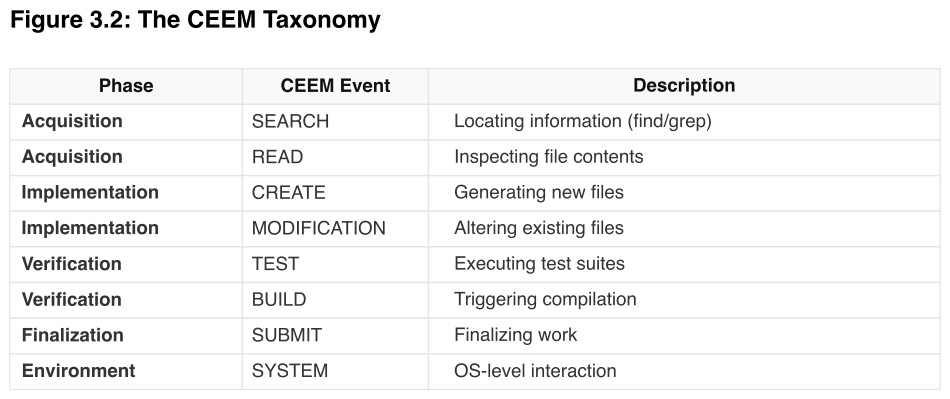
Mapping raw terminal commands to these canonical events structures the execution data for mathematical analysis. It would look something like this:
Figure 3.3
Raw vs. Normalized Event Stream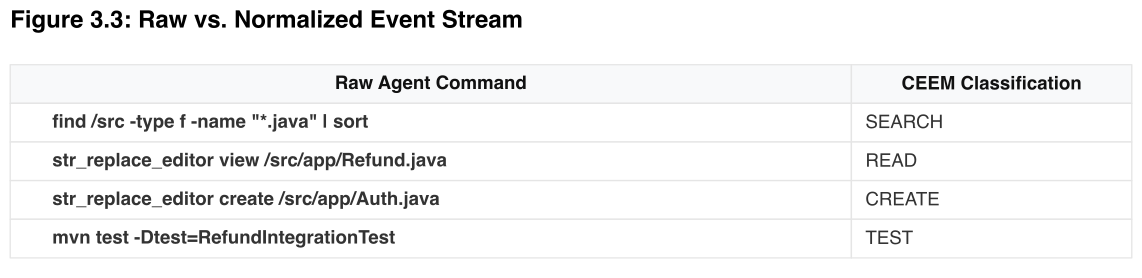
Note: While CEEM provides the canonical categories, building a deterministic parser to map the chaotic of terminal outputs into these categories is an evolving challenge. Real-world parser outputs occasionally return UNKNOWN classifications for highly ambiguous commands, which will be addressed in future RFCs.
So, with the execution data categorized, our experiment requires a controlled environment to test the architectural variable.
Isolating the Structural Variable
Testing whether repository architecture affects the cost of machine comprehension requires an experimental design that isolates architecture as the sole variable. If the agent’s internal reasoning logic changes between runs, or if different foundational models are deployed, any variance in the final token cost can be attributed to the model’s intelligence rather than the codebase. To establish a rigorous benchmark, the agent must be locked in a somewhat completely deterministic state.
This benchmark utilizes identical engineering prompts, an identical agent framework (SWE-Agent), and a fixed foundational model. The engineering task objective remains strictly constant. Only the architectural arrangement of the codebase changes. Why SWE-Agent? Well currently it provides us the telemetry detailed enough for us to test our hypothesis against multiple repositories.
Figure 3.4
The Experimental Control Matrix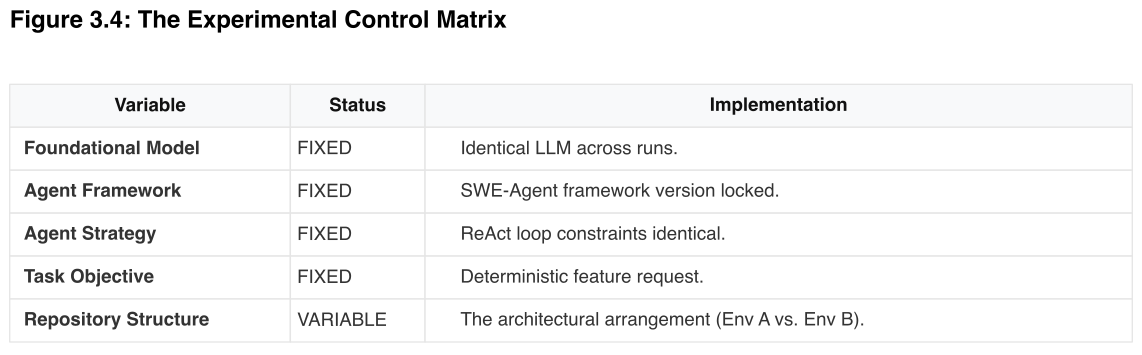
Testing the traversal mechanics requires a corpus of realistic software engineering projects spanning different scales of complexity. The Initial Reference Corpus pairs projects containing identical business logic but directly different architectural topologies. Environment A represents fragmented, structurally entangled architectures where logic is spread across multiple layers. Environment B represents colocated, bounded architectures where highly related logic sits in the same directory.
Figure 3.5
The Initial Reference Corpus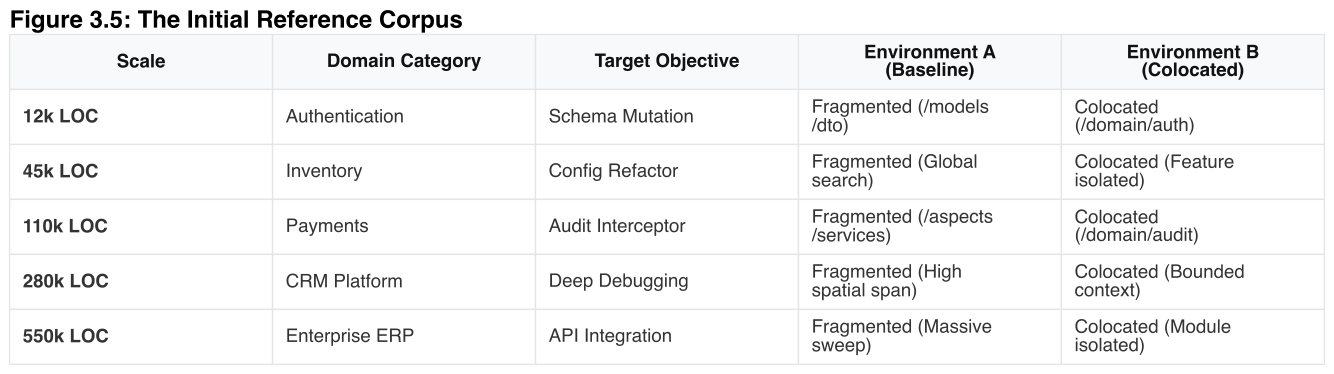
Testing five different scales generates a scaling curve rather than a static cost difference. If the hypothesis is correct, the cost of context acquisition in a fragmented architecture will not scale non-linearly, compounding as the architectural boundaries grow further apart. So naturally, multiple data points across the size spectrum are required to observe this escalation. The agent must also perform multiple types of engineering actions because navigating a repository to fix a localized bug requires different traversal mechanics than navigating a repository to inject middleware across multiple services.
Figure 3.6
The Case Study Matrix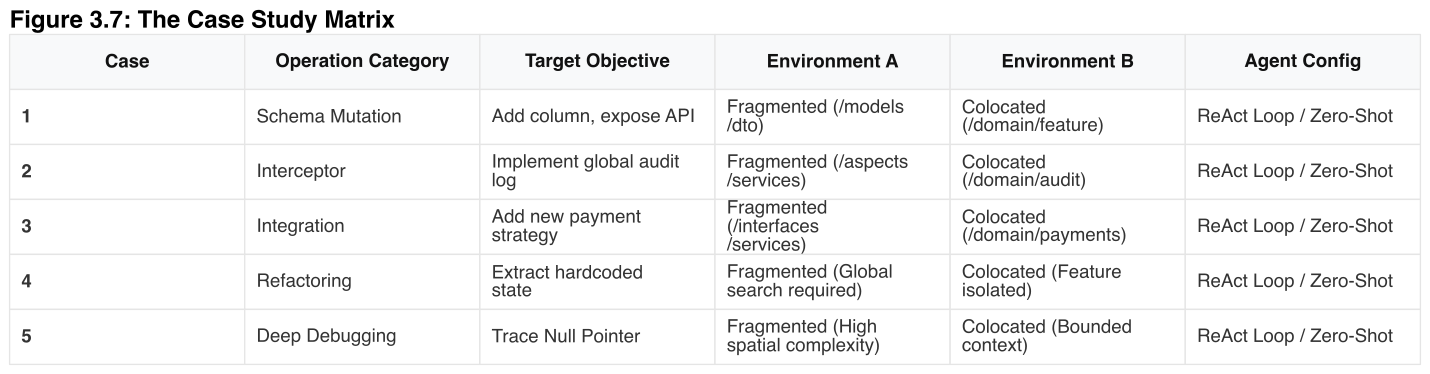
Open Instrumentation
The Context Economics Benchmark (CEB) operates as an open engineering instrument. Because I believe that the underlying economics of AI-assisted development impact the entire software sector, so the tooling required to measure those economics must remain accessible to everyone. The reference corpus, the benchmark engine, and the CEEM parser are designed for local execution. Developers can clone the environments, verify the telemetry, and run the benchmark directly against their own internal architectures and repositories.
Now, the control matrices are set and the vocabulary is standardized. We’ve also isolated the single variable required to determine exactly how architectural topology impacts the cost of machine comprehension. We are now ready to start our experiment.