The Interpretation
Context Density, Traversal Cost (ATC), and the governing laws of machine comprehension economics.

Lead Software Engineer & Systems Architect
- Formalizing the Metric Hierarchy: Context Density, ATC, EMR, and Context Debt.
- Mathematical formulation of the Exploration-to-Modification Ratio (EMR).
- The economic scaling law: how repository entropy compounds AI inference costs.
The Economics of Machine Comprehension Part 5: Interpreting repository traversal, exploratory overhead, and token expenditure and what it reveals
In the last part, we had successfully isolated the overhead of context acquisition by mapping the execution trace and measuring the resulting financial cost. First we looked at the Case Study 3, where a 573,112-token consumption rate for the fragmented environment compared to a 392,431-token rate for the colocated environment was a gap too large to dismiss as a mere statistical noise. We must dig deeper and salvage any metrics we can find so we can effectively measure the agent’s behavior.
However, raw telemetry alone is insufficient for an engineering analysis. Just as the advent of cloud computing forced the industry to formalize concepts like “provisioning” and “compute sprawl,” this specific architectural friction requires a formal vocabulary. If machine-comprehension cost is an active, measurable property of software development, we must develop strict mathematical definitions to track it over time. So, translating the raw output of the laboratory into a structured framework is the necessary next step in this investigation.
When Identical Tasks Behave Differently
Before establishing a formal metric taxonomy, we must aggregate the complete output of Case Study 3 (the global audit interceptor) to understand the impact of the architecture-driven divergence. When the telemetry from Case Study 3’s Environment A (Fragmented) and Environment B (Colocated) is placed side-by-side, the data reveals a pattern of increased computational cost in the fragmented environment that extends well beyond simple execution speed.
Figure 5.1
Complete Telemetry Summary (Case Study 3)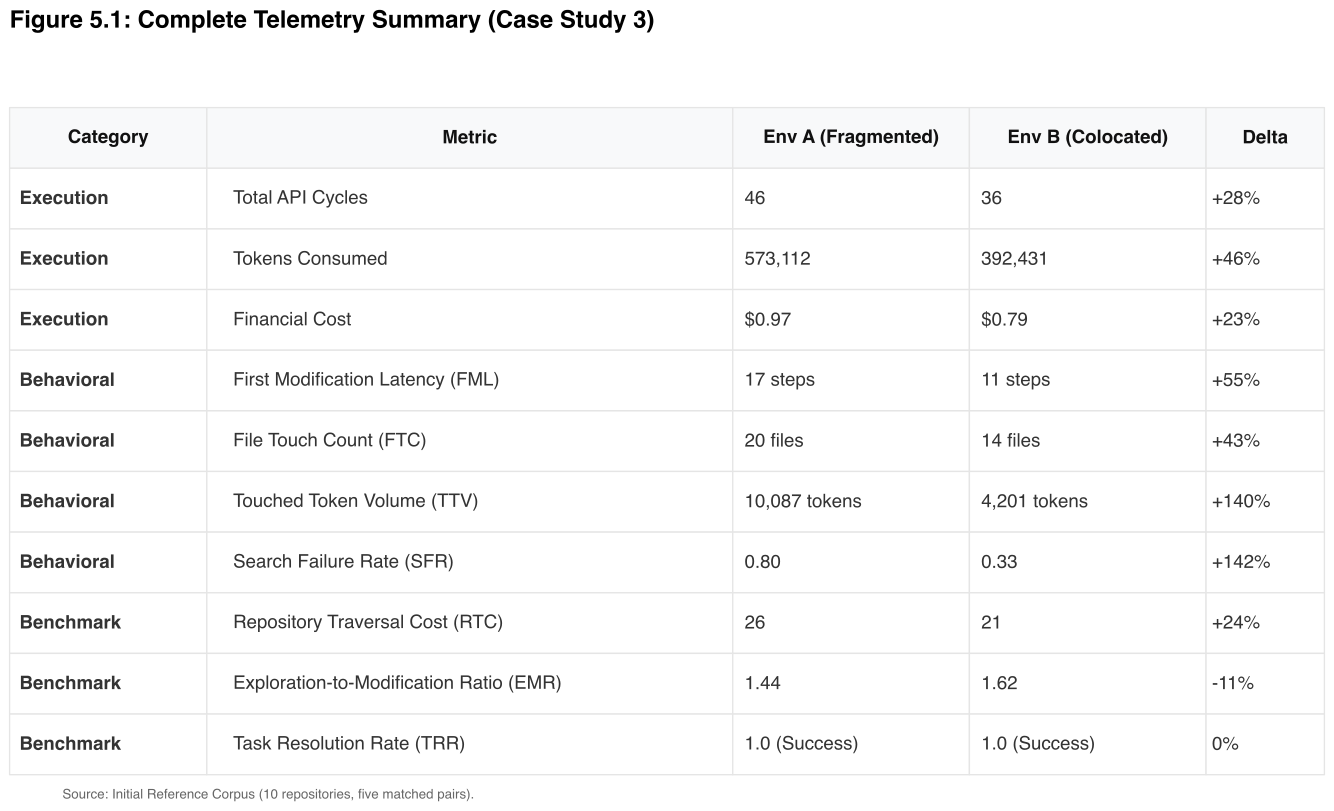
The aggregated telemetry demonstrates that the agent operating within Environment A processed the repository under higher computational load and elevated search failure rates. To achieve the exact same engineering outcome, the architecture forced the agent to access 43% more files, ingest 140% more raw file content, and fail at search queries at a rate of 80%. This load inevitably compounded into a significantly higher financial invoice. But, making these aggregate numbers actionable for us will require isolating exactly what each metric measures, and how it interacts with the agent’s context window, and also why it matters at an enterprise scale.
Interestingly, one specific result in the table initially seemed to undermine our underlying hypothesis. My expectation was that token consumption would scale predictably with repository size, assuming that a larger repository would naturally consume more tokens regardless of its structural topology. However, the benchmark repeatedly demonstrated that repository topology produced larger variances than repository size itself! For example, a 110,000 LOC colocated repository consumed fewer total tokens than a 45,000 LOC fragmented repository across multiple case studies. While scale was undoubtedly a contributing factor, the architectural structure was the dominant variable that governed context costs. This is why running tests is important across multiple complexities and sizes, it was this unanticipated result that shaped the metric definitions we’re going to name next.
Naming the Observations
When analyzing an execution trace, the benchmark naturally produces three layers of information. The first is Execution Telemetry, which records operational measurements such as API calls, token consumption, and execution cost. The second is Behavioral Telemetry, which captures the sequence of actions the agent performed while exploring and modifying the repository. The third is Benchmark Metrics, which summarize those behaviors into measurable properties such as Repository Traversal Cost (RTC) and Exploration-to-Modification Ratio (EMR). These metrics become meaningful only when interpreted alongside the execution timeline that produced them.
Figure 5.2
The Telemetry Overlay[Step 1-17] = First Modification Latency (FML): The region of exploratory directory scanning before the agent executes its first CREATE event.
[Total SEARCH + READ Events] = Repository Traversal Cost (RTC): The sum of all navigational actions required.
[Exploratory Events ÷ Mutative Events] = Exploration-to-Modification Ratio (EMR): The proportional relationship between finding code and writing code.
These specific measurements constitute the vocabulary of The Economics of Machine Comprehension as they define the structural overhead observed in the execution trace. Arriving at this vocabulary took me quite a bit of time as it included rigorous iteration and continuous refinement, often causing me to revisit or change earlier metrics I had defined. The earliest version of this framework tracked a single synthesized score called the Context Expenditure Score (CES) which attempted to collapse all traversal behavior into one number. I later learned that this failed as a primary metric, as a high CES produced by massive read volume appeared mathematically identical to a high CES produced by recursive search failures, entirely masking the distinct underlying mechanics, defeating the purpose of this benchmarking. A repository containing ten massive files and a repository containing sixty fragmented files produced identical CES scores while presenting radically different navigation requirements to the agent. It became clear that these differing behaviors required separate, precise classifications to be useful for diagnostic engineering.
A similar problem emerged during the initial definition of Repository Traversal Cost. An early version included test events in the count under the premise that test execution is a form of agent interaction with the repository. This proved to be a critical classification error, because including test events distorted the ratio in repositories containing heavy test coverage, making thorough verification appear as navigational overhead. An agent that verified its work carefully appeared to have traversed more code, effectively penalizing good engineering practices. Test events were ultimately removed from RTC, and the metric stabilized when it was narrowed strictly to the sum of search and read events.
1. First Modification Latency (FML)
In Environment A of Case Study 3, the agent executed seventeen consecutive actions involving searches, directory reads, and file inspections before writing a single line of code. Experiencing seventeen steps of pure orientation before the first state change occurred was an observation that demanded a dedicated metric.
Definition: The absolute number of API cycles executed by the agent before it attempts its first state-changing action (CREATE or MODIFICATION).
What it measures: FML acts as the purest metric of initial orientation effort. A high FML indicates that the system boundaries are failing to provide spatial clues, meaning the agent cannot determine where to begin without first consuming massive context volume. In Environment B, FML was only 11. The 55% difference between the two environments is a precise measurement of how opaque the architectural boundaries were to the machine.
2. Search Failure Rate (SFR)
The four failed search commands documented during the interceptor task represent the observable signature of an architecture lacking spatial clues. I observed that the agent was systematically degrading from searching for specific filenames to relying on broad wildcard queries in attempts to locate the logic.
Definition: The percentage of SEARCH events that return zero useful results, forcing the agent to retry, broaden its wildcard scope, or query an entirely new directory path.
What it measures: SFR effectively measures the semantic predictability of the repository. In Environment B, tests reside directly adjacent to the implementation files they verify, dropping the SFR to a manageable 33%. In Environment A, tests and schemas are separated from the core logic by multiple directory levels, driving the SFR to an unsustainable 80%. High SFR is the primary mechanism by which architectural entanglement generates severe financial cost. Every failed search forces the agent to transmit its failure history back to the foundational model in the subsequent prompt, bloating the context window with useless data. Again, this is to not recommend ideal project structure, it is to demonstrate how architecture affects agent behavior.
3. Touched Token Volume (TTV) and File Touch Count (FTC)
The agent in Environment A accessed 20 distinct files and ingested 10,087 tokens of raw file content to complete the interceptor task, whereas in Environment B it accessed only 14 files and ingested 4,201 tokens. Since both environments contained the identical underlying logic, the additional files were accessed because the architecture provided no reliable signal regarding file relevance.
File Touch Count (FTC): The absolute number of unique files opened by the agent during task execution.
Touched Token Volume (TTV): The raw volume of tokens ingested directly from those specific file reads.
What they measure: FTC and TTV collectively quantify repository exposure, which is the total surface area of the codebase the agent was forced to process. The 140% increase in TTV observed in Environment A represents significant context dilution, as you can see that the agent had to load a disproportionately larger fraction of the repository into its context window just to establish the necessary relationships. High TTV directly correlates with increased correction cycles, as the statistical model must maintain focus across large volumes of irrelevant syntax without losing track of the core task.
Figure 5.3
Touched Token Volume Across the Initial Reference Corpus.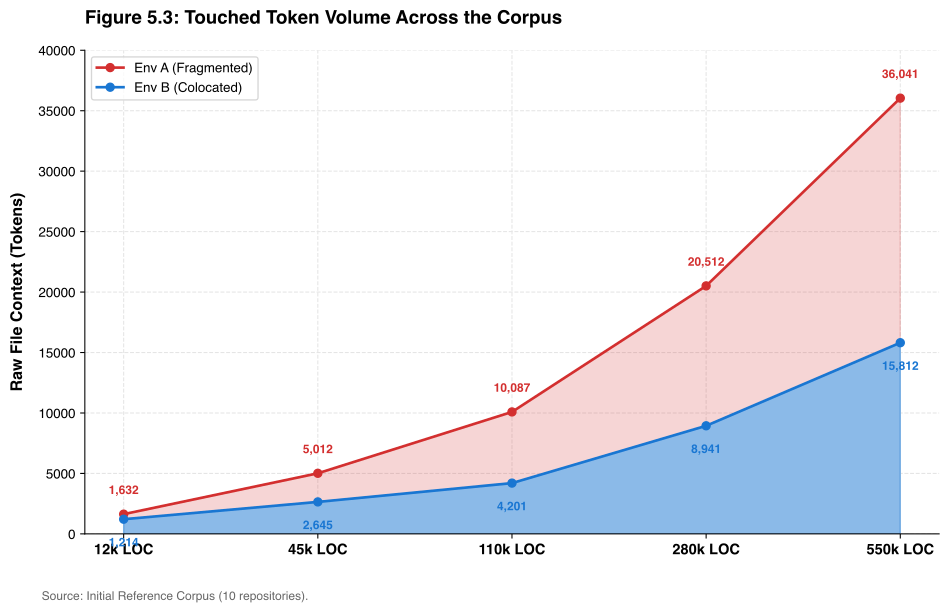
Touched Token Volume, the raw tokens ingested from direct file reads diverges between environments as repository scale increases. At 12k LOC the gap is modest (1,214 vs 1,632 tokens). By 550k LOC, Environment A is ingesting 36,041 tokens from file reads alone, more than double the 15,812 required by Environment B. The widening area between the two curves represents context being consumed purely because the architecture provided no reliable signal about which files were relevant.
4. Repository Traversal Cost (RTC)
By the time both agents submitted their completed work, one had executed 26 search and read events to complete the task while the other had executed only 21. Both agents resolved the identical task successfully, meaning the numerical difference between them is mostly navigational.
Definition: The sum of all SEARCH and READ events required to complete a task.
What it measures: RTC serves as the unit of navigational distance. It measures how far the agent had to traverse through the physical repository structure to reach its destination and complete the assignment.
5. Task Resolution Rate (TRR)
Definition: An outcome metric indicating whether the agent successfully completed the assigned task (1.0) or failed (0.0).
What it measures: TRR acts as the ultimate pass/fail condition for the experiment. If TRR is 0.0, all the other metrics simply represent the computational cost of failure. If TRR is 1.0, the metrics represent the true computational cost of success.
By standardizing these metrics, the instrumentation required to measure machine-comprehension cost achieves dimensional precision. Applying this vocabulary systematically across the entire corpus is the final requirement for validating the theory.
The Measurements Across the Corpus
Applying formal metrics to a single integration task successfully isolates the mechanics of the traversal, but applying them across the entire Initial Reference Corpus exposes the actual laws of scale. When I aggregated the telemetry from all five case studies across all five architectural scales (ranging from 12,000 to 550,000 LOC), the data crystallized into non-linear curves.
The first metric I tracked across the entire corpus was the Exploration-to-Modification Ratio (EMR). My primary objective was to understand if the agent was consistently forced into exploratory loops regardless of the specific task type being executed.
Figure 5.4
Exploration-to-Modification Ratio (EMR) Across the Corpus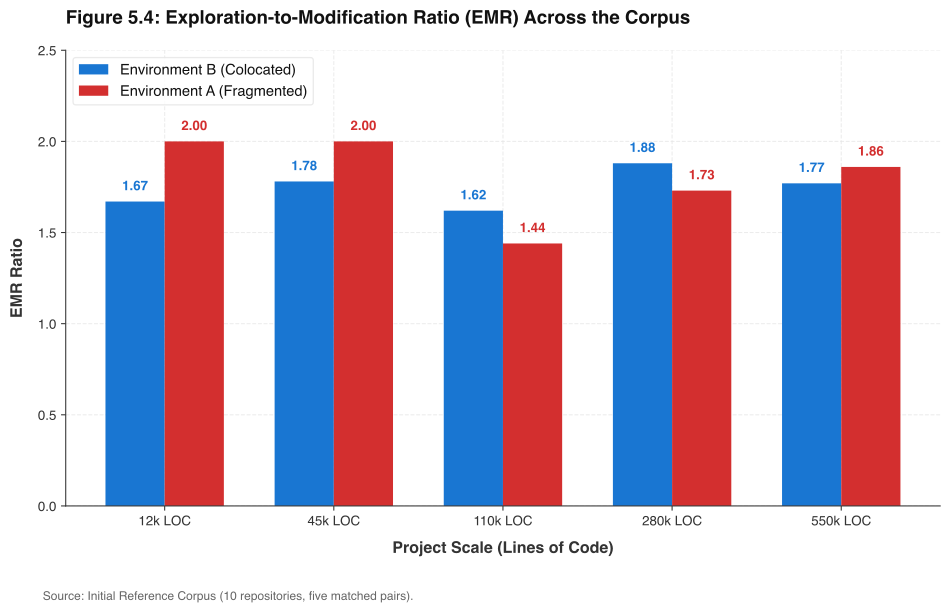
When examining the EMR data, I noticed a paradox that initially appeared to be a fatal flaw in the experiment. In Case Study 3, the agent in the fragmented architecture (Env A) exhibited a lower EMR (1.44) than the agent in the highly efficient colocated architecture (1.62). At first glance, a lower ratio in the fragmented environment contradicted the underlying hypothesis that fragmentation causes navigational bloat. I thought the entire hypothesis was falling flat.
But, analyzing the mutative event counts revealed the true mechanism behind the anomaly. The agent in Environment A was so disoriented by the fragmented boundaries that it engaged in massive trial-and-error coding to find a solution. It executed 18 mutative events compared to the highly efficient 13 mutative events executed in Environment B. This severe spike in mutative mistakes artificially inflated the denominator of the equation, and therefore suppressing the final EMR score.
This result serves as a warning that proportional metrics are highly deceptive when an architecture actively degrades an agent’s execution quality. Observing the true pattern of architectural entanglement requires analyzing the computational penalty incurred as the repositories grow, rather than relying solely on ratios. Lesson learnt.
Moving on, I discovered a second major boundary condition at the opposite end of the scale. At 12,000 lines of code, the financial difference between the fragmented and colocated environments was statistically insignificant. The repository was simply too small for spatial separation to impose any computational overhead on the agent. The agent remained close enough to the entire codebase that fragmentation rarely forced recursive search failures or massive context dumps. This measurement establishes precisely where the hypothesis begins: the cost law of The Economics of Machine Comprehension does not activate meaningfully below a specific repository scale threshold.
Figure 5.5
Traversal Overhead Escalation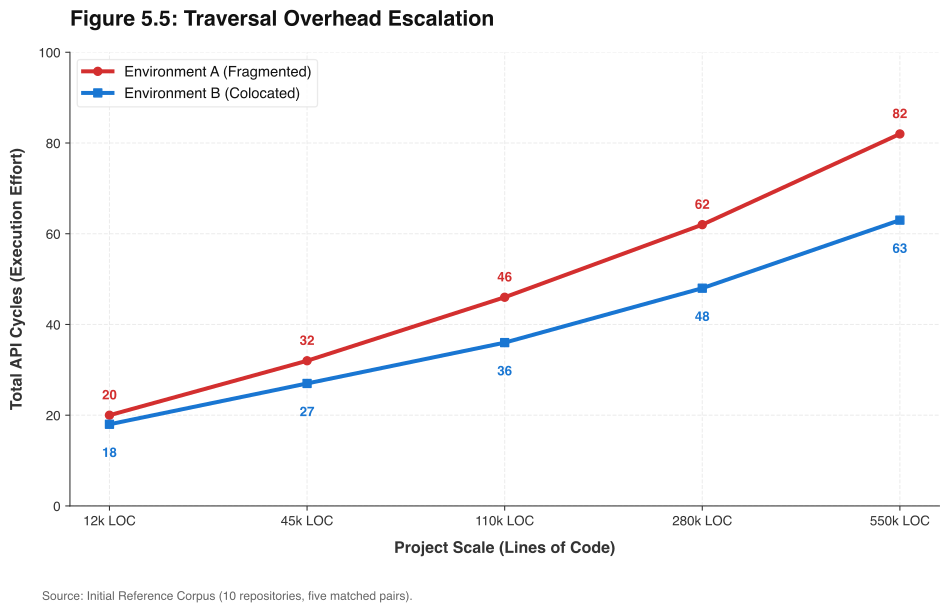
This chart serves as the record of the The Economics of Machine Comprehension hypothesis. At 12,000 lines of code, a fragmented architecture imposes a negligible traversal penalty because the repository is small enough that even with broad wildcard searches, the resulting noise fits within the agent’s working context limit. The agent can hold a sufficient directory map of the microservice in memory without incurring massive token costs.
As the repository scales up to the 550,000 LOC enterprise monolith, the traversal dynamics shift quite a lot. In a repository of this magnitude, a failed search triggers a cascade of increasingly broad wildcard scans across massive utility folders. The agent in Environment A was repeatedly forced to load these massive lists of irrelevant file paths into its active memory simply to determine where not to look.
This cascading context expansion generates Absolute Traversal Overhead.
Figure 5.6
Absolute Traversal Overhead per Project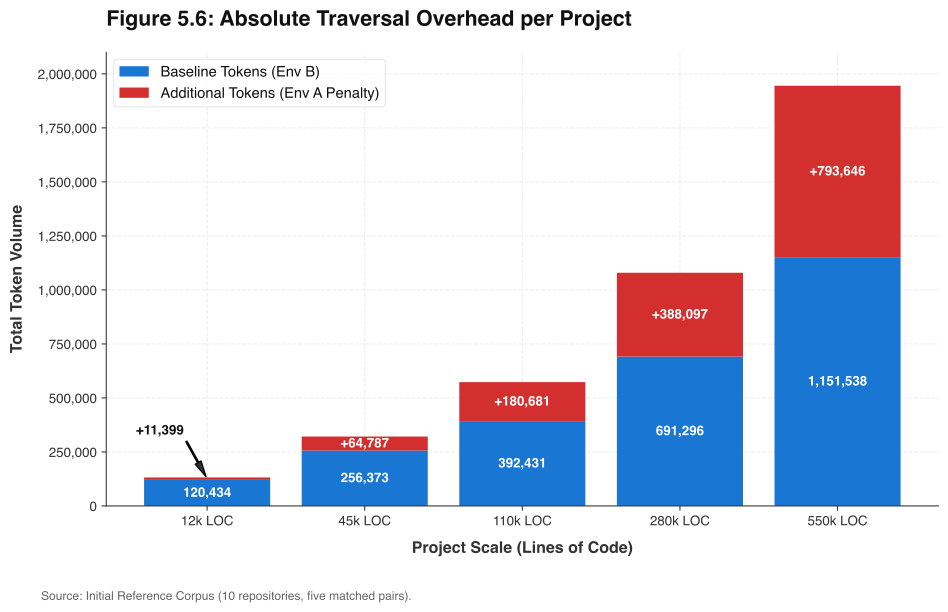
Traversal Overhead represents the waste of the system. It quantifies the tokens spent dragging the agent across the architecture before it can generate any actual engineering value. In the colocated architecture (Env B), the baseline tokens scaled predictably alongside the complexity of the engineering tasks. In the fragmented architecture, the Additional Tokens eclipsed the baseline, resulting in the agent spending the vast majority of its computational power fighting the directory structure rather than writing code.
The final question in The Economics of Machine Comprehension is how those additional tokens manifest financially. By applying standard inference rates to the token consumption, we reveal the Token Premium: the percentage increase in token consumption (and thus cost) an engineering team pays purely as a penalty for disjointed architecture. Ultimately, this physical overhead translates directly into the primary concern of enterprise engineering leadership: the invoice.
Figure 5.7
Machine-Comprehension Token Premium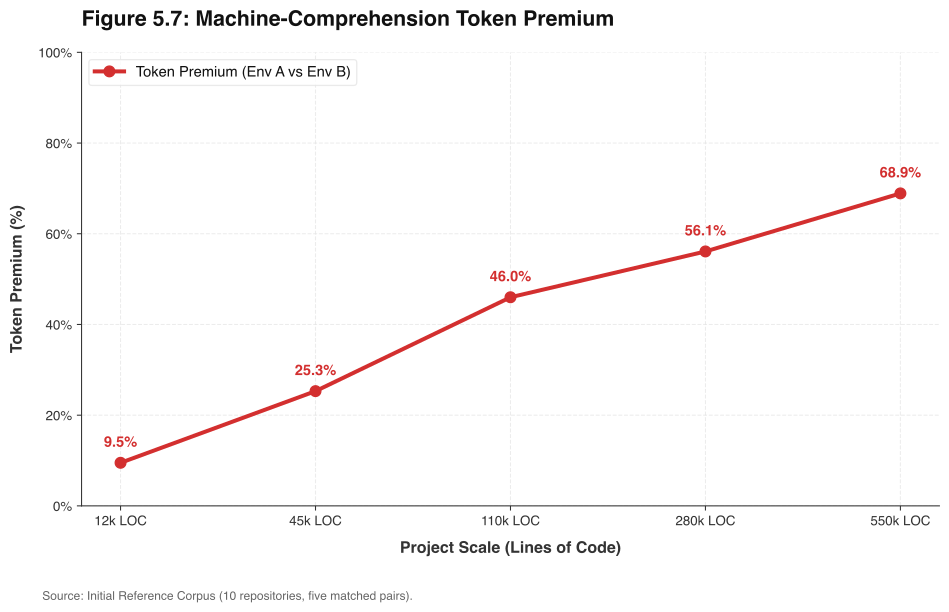
The telemetry across the corpus confirms that architectural entanglement is no longer merely an aesthetic preference for developers to endlessly debate in pull requests. It is a compounding financial liability. The telemetry strongly indicates that machine comprehension cost operates as a highly measurable, economic property of modern software systems.
Machine Comprehension as a Measurable Property
Through the benchmark we now have successfully generated evidence, and the metric hierarchy provides a standardized language for discussing that evidence. What engineering community chooses to do with those measurements is a separate question. By applying the metric hierarchy, we can finally move beyond subjective debates about repository design and examine the observable data directly.
Figure 5.8
The Metric Hierarchy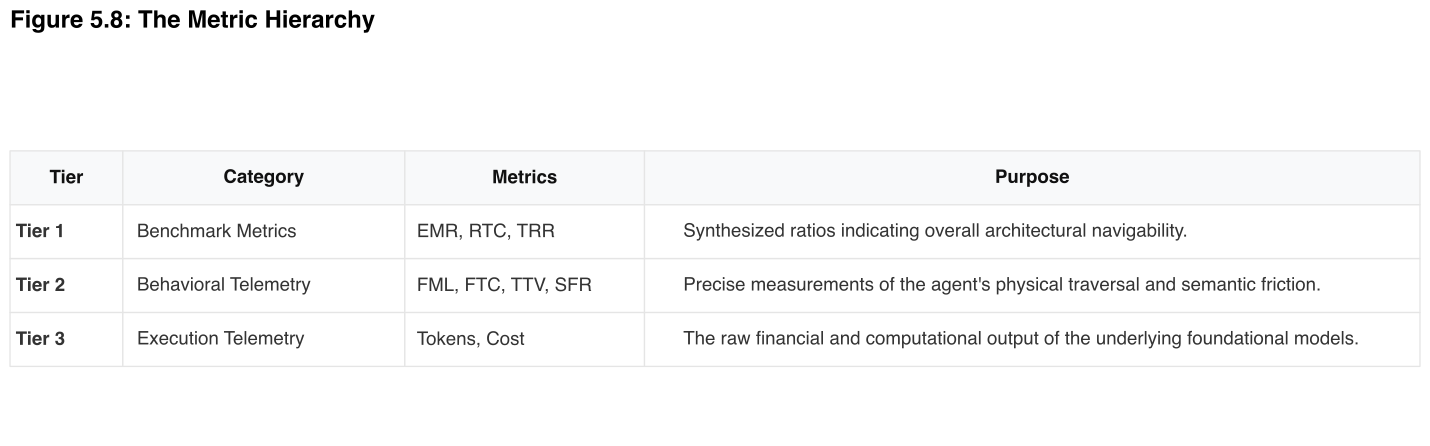
Despite the paradox observed in degraded architectures where trial-and-error inflates mutative counts, EMR remains a vital Tier 1 benchmark metric, as under standard, non-catastrophic conditions, it is the most reliable indicator of whether an agent is spending its tokens finding code or writing code.
When an organization deploys agentic workflows at scale, this telemetry attempts to resolve the ambiguity of cloud inference bills. We can run the CEB pipeline to measure how much exploratory cost our specific architecture is generating. We can identify the exact directories causing high Search Failure Rates (SFR) and measure the First Modification Latency (FML) to determine precisely where our system boundaries are too opaque for an autonomous agent to navigate efficiently.
However, introducing precise financial measurement into software engineering demands a critical philosophical boundary. If it is possible to measure how expensive an architecture is for a machine to comprehend, the immediate temptation for engineering leadership will be to optimize strictly for the machine. If a low File Touch Count (FTC) and a low Exploration-to-Modification Ratio (EMR) result in cheaper inference costs, an engineer might conclude that the most “efficient” architecture is to compile all logic into a single, massive 100,000-line file. Under that disastrous scenario, the agent would never need to execute a directory search and the machine-comprehension cost would plummet. Succumbing to that temptation would lead to a catastrophic architectural mistake.
Goodhart’s Law warns that when a measure becomes a target, it ceases to be a good measure. The Economics of Machine Comprehension metrics are intended to be used as diagnostic instruments to understand friction, rather than targets for extreme code-golfing optimization. Preventing this dangerous anti-pattern requires a foundational boundary condition that must govern all future research in this discipline.
Human Primacy Principle
Human maintainability remains the primary, overriding objective of software engineering, as it remains of The Economics of Machine Comprehension too. Machine-comprehension cost is strictly a secondary constraint, a repository that requires fewer API cycles to navigate is not inherently superior. These metrics are designed to measure machine execution, not to grade overall architectural quality. Code is written, debugged, and expanded by human beings; employing machines to assist in this process does not alter the primacy of human readability.
The Economics of Machine Comprehension hopes to provide the instrumentation required to understand the exact financial cost of architectural decisions when evaluated by an autonomous agent. It does not dictate that those decisions must unconditionally change in favor of the machine. It simply ensures that engineering departments are no longer absorbing the cost in the dark. The mechanics of context acquisition are fully mapped. Moving this measurement apparatus out of the laboratory and subjecting it to public verification is the final step of this investigation.