The Experiment
Benchmarking identical engineering tasks across monolithic, modular, and fragmented topologies.

Lead Software Engineer & Systems Architect
- Step-by-step telemetry of agents traversing fragmented vs. colocated repository boundaries.
- The discovery of Search Failure Cascades in poorly modularized codebases.
- Systematic proof of 10x token inflation on identical business requirements.
The Economics of Machine Comprehension - Part 4: Measuring Machine Comprehension and Benchmark results from fragmented and modular architectures.
In the previous part we established a laboratory architecture that isolates repository structure as an independent variable. With the Context Economics Event Model (CEEM) functioning as the standardized behavioral vocabulary, and the Initial Reference Corpus providing the required testing data, this investigation now transitions from theoretical modeling to systematic execution. To measure the cost of architectural entanglement, it is necessary to deploy the autonomous agent and observe its execution paths.
For this demonstration, a standard AI agent is configured to execute a standard ReAct loop using a state-of-the-art foundational model. We’ll first run it against a model project created to validate this hypothesis, i.e. the Case Study 3: An interceptor task. This repository is specifically created to simulate two distinct architectures of one project, I wanted to first test my hypothesis in a model environment before I gathered more repositories and refactored them into an agent-friendly territory. Here, our deterministic objective is to implement a global audit logging interceptor that captures a specific payload across all qualifying service operations. The two distinct environments, where Environment A represents a highly fragmented, layered architecture where business logic is scattered across multiple nested directories and Environment B represents a colocated, domain-driven architecture where related files reside within the same bounded context. Both repositories implement identical underlying business logic.
The objective is not to debate whether one architecture or a design pattern is subjectively superior for human developers, that is an academic discussion with no right answers. Our objective here is to determine whether the distance between related logic creates a measurable financial and computational penalty for the AI agent attempting to comprehend it.
The Timeline of Traversal
First, let’s zoom into this model case study 3 before we examine the broader metrics of the reference corpus. When the AI agent boots up within Environment A, its initial behavior centers on establishing a directory map, as expected. It lacks awareness of the system’s boundaries. The first action the agent takes is a READ event, opening the project root to inspect the directory structure. The fragmented architecture immediately dictates the execution sequence. Because the core logic for the internal service is separated from its corresponding configuration files, data transfer objects, and API schemas, the agent enters a pattern of rapid directory scanning.
In Environment A, the agent spends its first seventeen operational steps executing search and read commands. It runs 21 distinct READ events and 5 SEARCH events to build a sufficient context window across the scattered boundaries. It does not attempt a single file modification during this phase. At step 18, after ingesting significant repository surface area, the agent finally acquires enough context to execute a CREATE event and then finally begin implementation.
On the other hand, when the same agent is deployed within Environment B to solve the exact same integration problem, the execution chronology changes. Because the necessary logic is colocated within a bounded domain, the initial directory mapping is highly efficient. The agent requires only eleven steps of exploration before it begins implementing code, and it reads 15 files instead of 21.
By the time both agents successfully complete the integration task, verify the logic via tests, and submit their code, the divergence in [[[API calls is directly observable in the telemetry. The agent operating in the fragmented environment required 46 total API cycles to resolve the issue, whereas the agent in the colocated environment required only 36.
Figure 4.1
Case Study 3 Event Distribution (Env A vs. Env B)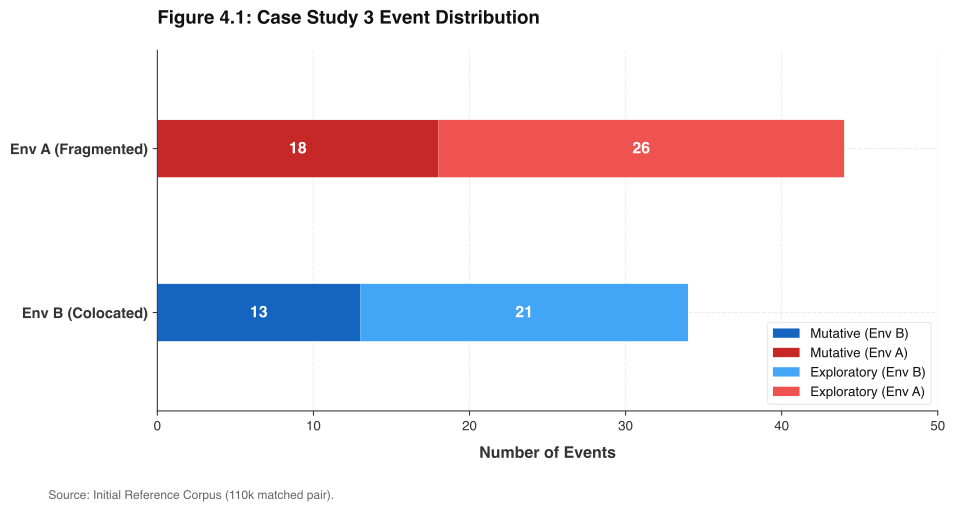
Env A (Fragmented): SEARCH (5), READ (21), CREATE (11), MODIFICATION (2), TEST (5), SUBMIT (2)
Env B (Colocated): SEARCH (6), READ (15), CREATE (8), MODIFICATION (2), TEST (3), SUBMIT (2)
This execution trace demonstrates the validation of our initial hypothesis: the agent in the fragmented environment requires significantly more API cycles to achieve the same result. To understand the mechanics of this overhead, it is necessary to isolate the specific events driving the additional computational load. This brings me to the next obvious symptom, Search Degradation.
Search Degradation
When analyzing the execution timelines of the agent, the most severe behavioral divergence occurs during context acquisition. The agent operating within Environment A takes longer to read files and encounters its directory search commands actively fail, and more often.
In a fragmented architecture, related files rarely share a common directory path. So, when the agent attempts to update an integration test to match its newly created API schema, it cannot rely on spatial proximity so it must guess the location of the testing suite. In Environment A, the agent executes find /Environment-A -name “AuditIntegrationTest.java”. The search returns no results. Therefore, forced to broaden its context, the agent executes a wildcard search for ‘Audit’. The system returns null again. Surprisingly, what I didn’t expect was that while escalating the search parameters, it queries for ‘udit’ and scans the root /src directory for anything matching application. This does not imply that you must write your test-suite right next to the business logic or the implementation, that’s an academic discussion, we are documenting the changes in the agent behavior when you change repository structure.
The telemetry reveals a clear trial-and-error collapse in search efficacy where out of 5 total search attempts executed in Environment A, 4 return zero useful results. The agent consumes quite a lot of token volume executing broad directory scans because the architectural boundaries provide no structural indicators regarding the location of related dependencies. Conversely, in Environment B, the related directories and files relevant to the API reside directly adjacent to the implementation. The agent executes 6 search commands, but only 2 of them fail, allowing it to locate targets rapidly and proceed with the integration.
Watching the agent execute increasingly desperate wildcard searches in Environment A, I realized that fragmented architectures slow down machine comprehension.
Figure 4.2
Case Study 3 Search Failure Comparison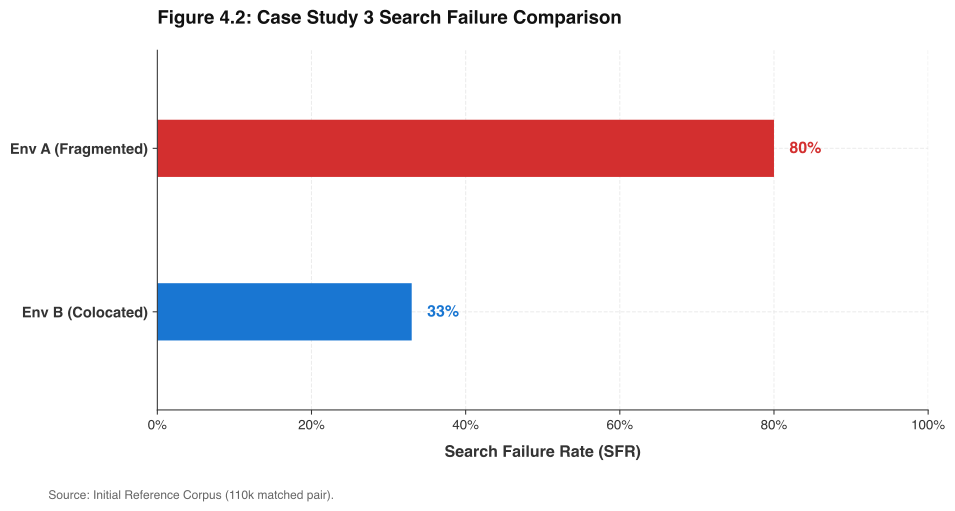
Actual Failed Commands (Env A):
* find /Environment-A -name "AuditIntegrationTest.java" -type f 2>/dev/null
* find /Environment-A -name "*Audit*" -type f 2>/dev/null
* find /Environment-A -name "*udit*" 2>/dev/null
* find /Environment-A/src -name "application.*" 2>/dev/null
One data point in the table initially appears contradictory: Environment B executed six total SEARCH events, which is one more than the five executed in the fragmented Environment A. This threw me off too, because on first reading, the colocated environment appears to be running more searches. Which made me think of any additional factor that I may be missing, which brought me to the Search Failure Rate, which resolves the contradiction. The agent in Environment B searched more frequently because its commands were successful which allowed it to locate dependencies on the first or second attempt and never escalated to broad wildcard patterns. The agent in Environment A executed fewer searches in total because it stopped issuing targeted commands and shifted to increasingly broad wildcard searches.
I discovered that this Search Failure Rate (SFR) is the direct, observable mechanism by which architectural entanglement generates financial cost. Every time the agent executes a failed search command, it transmits the previous failure history, the current repository state, and its subsequent intended action back to the LLM. As the agent navigates the fragmented boundaries, its context window fills with the memory of its own failed search commands. It is literally expending financial capital to process the fact that previous queries returned null, isn’t it interesting?
The Financial Shadow
The search degradation we observed in the execution timeline acts as a multiplier on the underlying inference cost. Every failed search, recursive directory scan, and repeated file read increases token consumption. When analyzing the cumulative token burn across the execution trace, the economic penalty of architectural entanglement is exposed.
During the initial stages of the integration task, the token consumption between Environment A and Environment B tracks relatively closely together as both agents execute basic exploratory commands. However, as the agent in Environment A begins to suffer from compound search failures and expanding context windows, the token consumption curve accelerates sharply.
By step 36, the agent in Environment B successfully implemented the integration, verified the logic through testing, and submitted its work. It consumed a total of 392,431 tokens, generating an inference cost of $0.79. At that exact same step, the agent in Environment A is still executing directory searches to locate the correct configuration files. It requires ten additional API cycles to finish the identical feature. By the time it finally submits its work at step 46, it has consumed 573,112 tokens, generating an inference cost of $0.97.
Figure 4.3
Cumulative Token Consumption for Case Study 3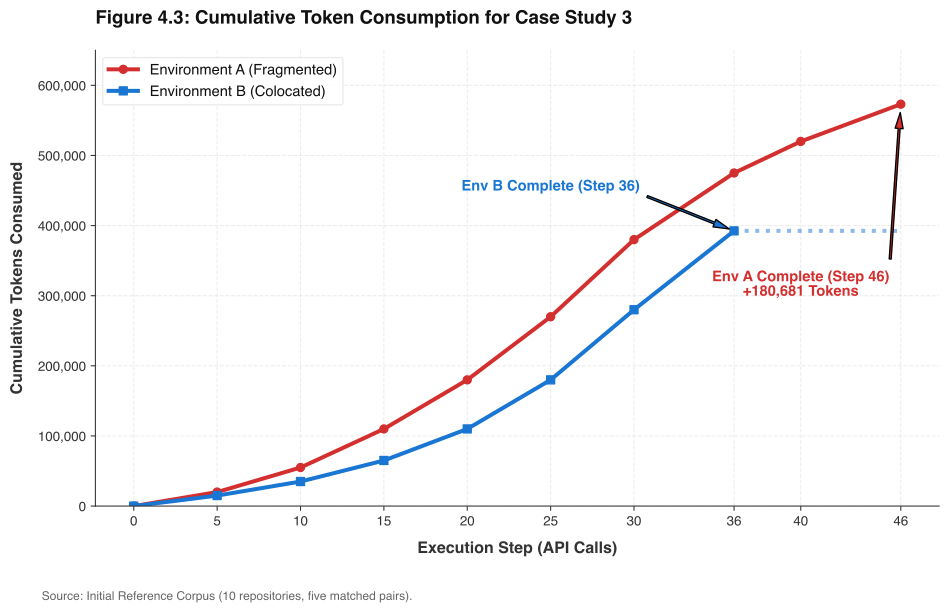
The fragmented architecture generated a 46% increase in raw token consumption to achieve an identical engineering outcome. However, raw token volume alone does not fully capture the risk profile. We must also evaluate the surface area of the repository that the agent was forced to process or traverse. In Environment B, the agent accessed 14 distinct files and ingested a Touched Token Volume (TTV) of 4,201 tokens of raw file content. In Environment A, the agent accessed 20 distinct files and ingested 10,087 tokens of raw file content.
Figure 4.4
Repository Exposure Comparison (Case Study 3)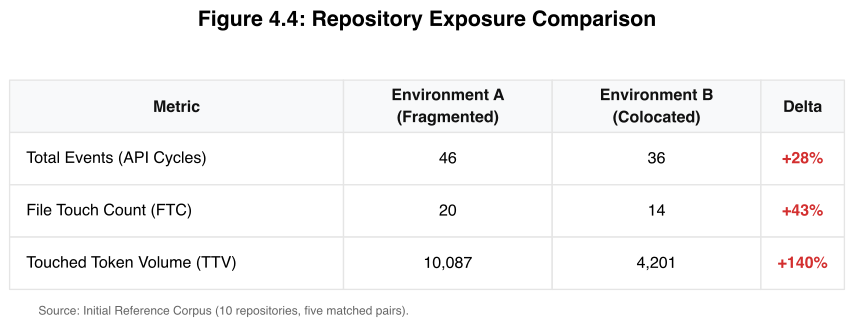
Because the necessary logic in Environment A was scattered, the agent was forced to load a significantly larger surface area of the repository into its active context window to establish the relationships between the files. By processing 140% more raw code, the agent diluted its attention matrix with irrelevant syntax and ultimately paid a massive premium in machine-comprehension cost.
The Pattern Across the Corpus
Now that we’ve validated our initial hypothesis, it’s time for us to examine our entire Reference Corpus, the telemetry from Case Study 3 validates the hypothesis in a localized instance. To ensure that this observation was not a coincidence or a statistical anomaly, the broader execution data across the remainder of the Reference Corpus must be analyzed. So, I asked the agent to execute the remaining four case studies (Schema Mutation, Integration, Refactoring, and Deep Debugging) across the other four architectural scales, ranging from the 12,000 LOC microservice up to the 550,000 LOC enterprise monolith. Let’s be extra sure that our experiment shows similar symptoms across various sizes and complexities.
If the architectural hypothesis holds true, the financial penalty of a fragmented architecture should not manifest only as a static percentage. As a repository scales in size and complexity, the physical distance between related layers grow, and the number of possible directory permutations also increases. Therefore, the context acquisition effort required to bridge those boundaries should compound non-linearly, in theory.
So, project-by-project, environment-by-environment, I executed the agent against all 10 repositories. When I sorted through the telemetry, the resulting curves demonstrated exactly the compounding causal chain we hypothesized. The degradation begins at the search layer.
Figure 4.5
Search Failure Rate Across the Initial Reference Corpus.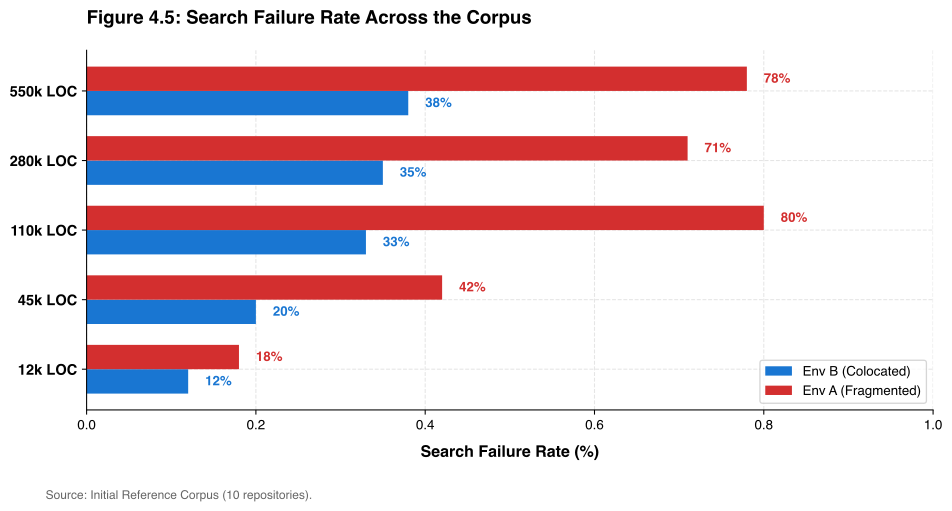
The search degradation observed in Case Study 3 holds across all five repository scales. Environment A’s SFR is consistently higher at every scale point, with the most severe divergence at the 110k-550k LOC range. Notably, the 12k microservice is the only scale where the gap is narrow enough to be negligible, consistent with the hypothesis that fragmentation effects become meaningful only above a critical size threshold.
Because the agent’s searches consistently failed, it was forced to execute more commands to achieve the identical engineering objective. This caused the total API cycles to escalate.
Figure 4.6
API Cycle Escalation Across the Initial Reference Corpus.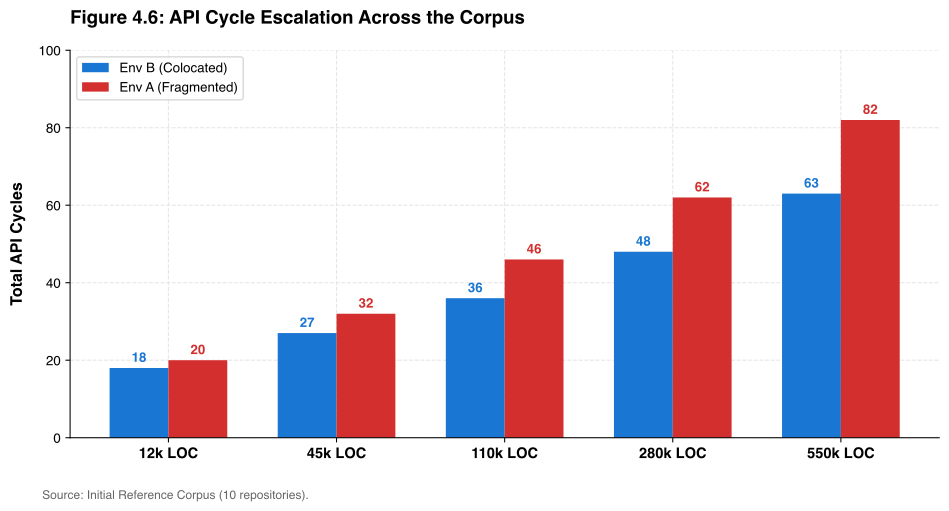
The pattern observed in Case Study 3 (46 vs 36 API cycles) is not an isolated result. Across all five repository scales, Environment A consistently requires more total inference cycles than Environment B to complete an identical task. The gap compounds as scale increases: at 12k LOC the difference is 2 cycles; at 550k LOC it has grown to 19 cycles.
This API escalation represented a significant shift in how the agent behaved. It took longer to orient itself, it opened more files, and it traversed a wider surface area of the repository.
Figure 4.7
Behavioral Telemetry Across the Initial Reference Corpus.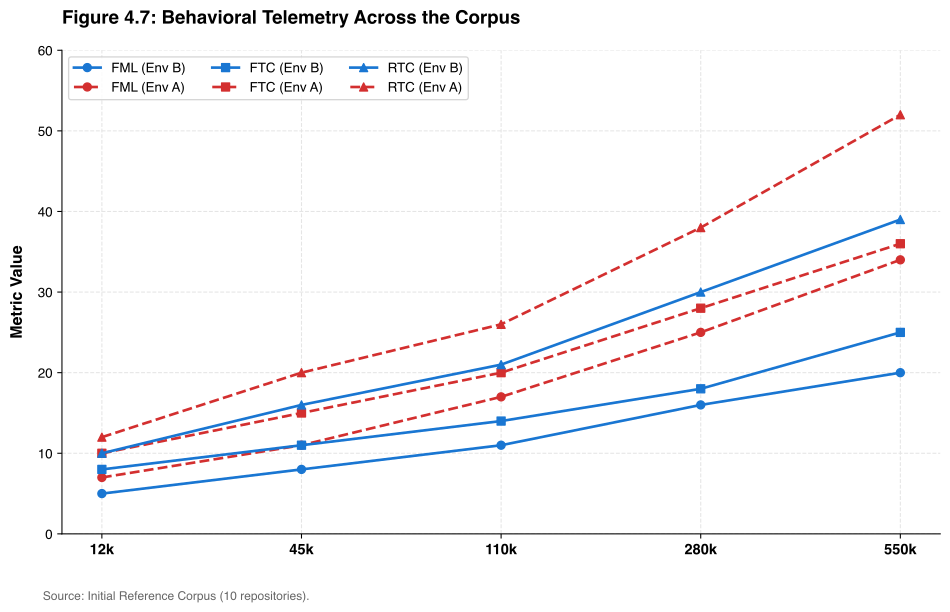
First Modification Latency (FML), File Touch Count (FTC), and Repository Traversal Cost (RTC) all compound together as repository scale increases. Environment A consistently leads on all three behavioral metrics at every scale point. The compounding nature of all three lines in parallel confirms that architectural fragmentation imposes a growing behavioral burden.
Finally, this behavioral burden manifests on the balance sheet. In the 550,000 LOC enterprise monolith, the computational cost of execution compounded against the architectural entanglement. This escalating load generates what we will term as the Cost of Fragmentation: the token volume and execution cycles spent purely on exploration that results in zero immediate code modifications.
Figure 4.8
The Cost of Fragmentation.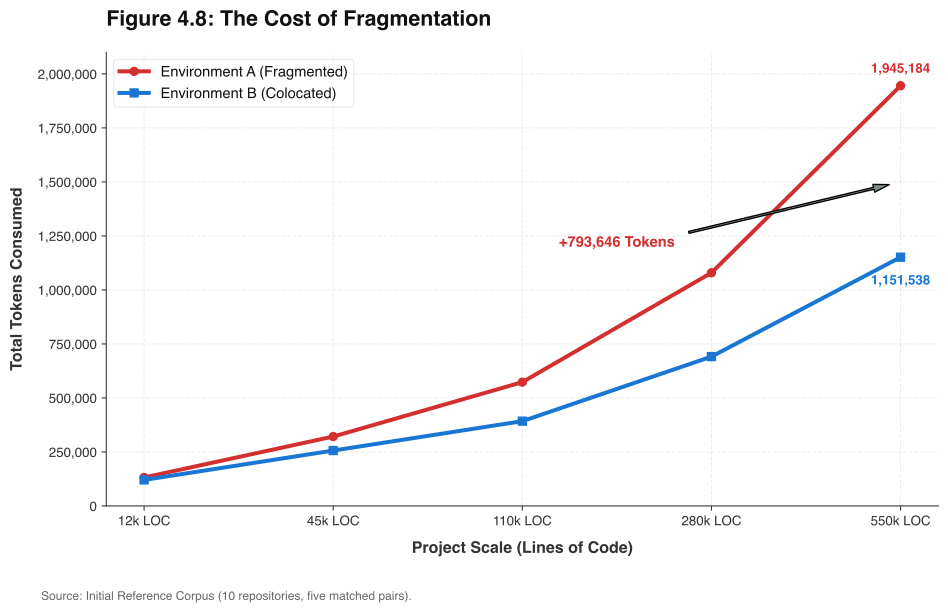
When we take a look at the aggregate token consumption across the five scales of the Initial Reference Corpus, the lines diverge, demonstrating that the financial penalty of fragmented architecture accelerates as project size increases.
The telemetry across the Initial Reference Corpus consistently indicates a clear pattern where the physical structure of a software repository directly dictates the cost of machine comprehension. A fragmented architecture causes a higher context acquisition cost compared to a colocated architecture, and that penalty scales non-linearly as the system grows. The resulting execution telemetry confirms that the architecture is the underlying cause. Translating these chaotic terminal outputs into a standardized vocabulary will provide us with a methodology to analyze our repositories.
The benchmark has produced data. So we must ask, what does it actually reveal?